1st Lt Henry Hewson Warde
Chiba Hospital

73rd Bomb Wing Mission # 10
Page 4


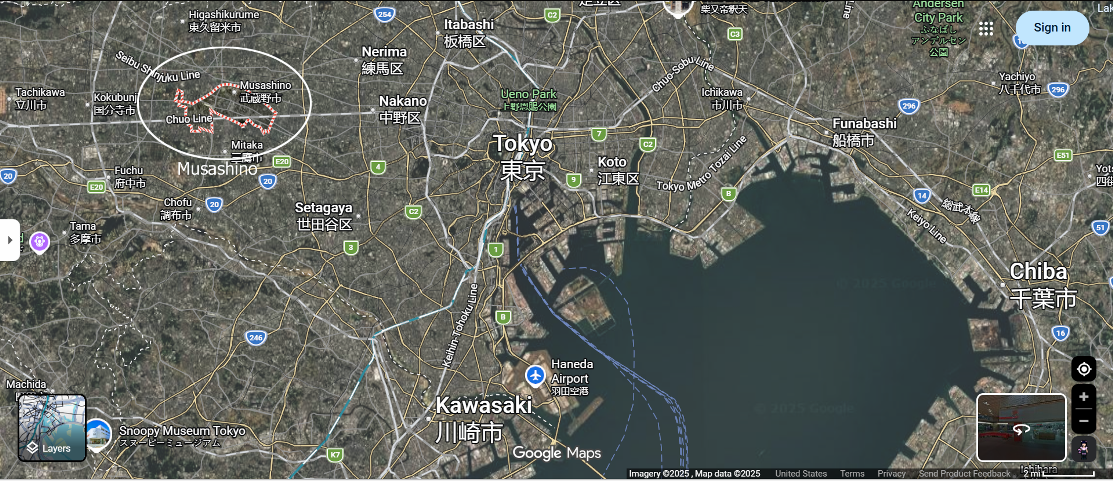
The focus of this page is maps and charts.

At the top is a Google Map showing the location of Musashino.

This is followed by navigation data with coordinates for
Assembly, Initial Point (IP) and Target.
The IP is the beginning of bomb run.

Next is the Radar Counter Measure ( RCM ) ( RAVEN ) chart
showing the track to and from the target.

Over time, these mission reports began to include
more navigation charts closer in with more details.

A sketch with the locations of the
primary and secondary targets follows this chart.

The vertical chart does not have as many details
as would appear in later mission reports.

These would show the area where attacks took place and
the location(s) where B-29s were lost.

This chart concentrates on cloud cover at
various altitudes along with the note:
523 attacks and passes

Last is a weather prognostic chart.

Each mission was preceded by three individual B-29s flying solo
to obtain weather informamtion.

These were called Weather Strike Missions.

A question: how did the weather people on Saipan
obtain data from all these far-away locations.

BACK TO TOP


LOCATION OF MUSASHINO
OUTLINED WITH WHITE OVAL


BACK TO TOP

THE ROUTE OUT
COORDINATES FOR
ASSEMBLY, IP ( INITIAL POINT ) , AND TARGET


BACK TO TOP

PART OF RADAR COUNTERMEASURE ( RCM )
TRACK


BACK TO TOP

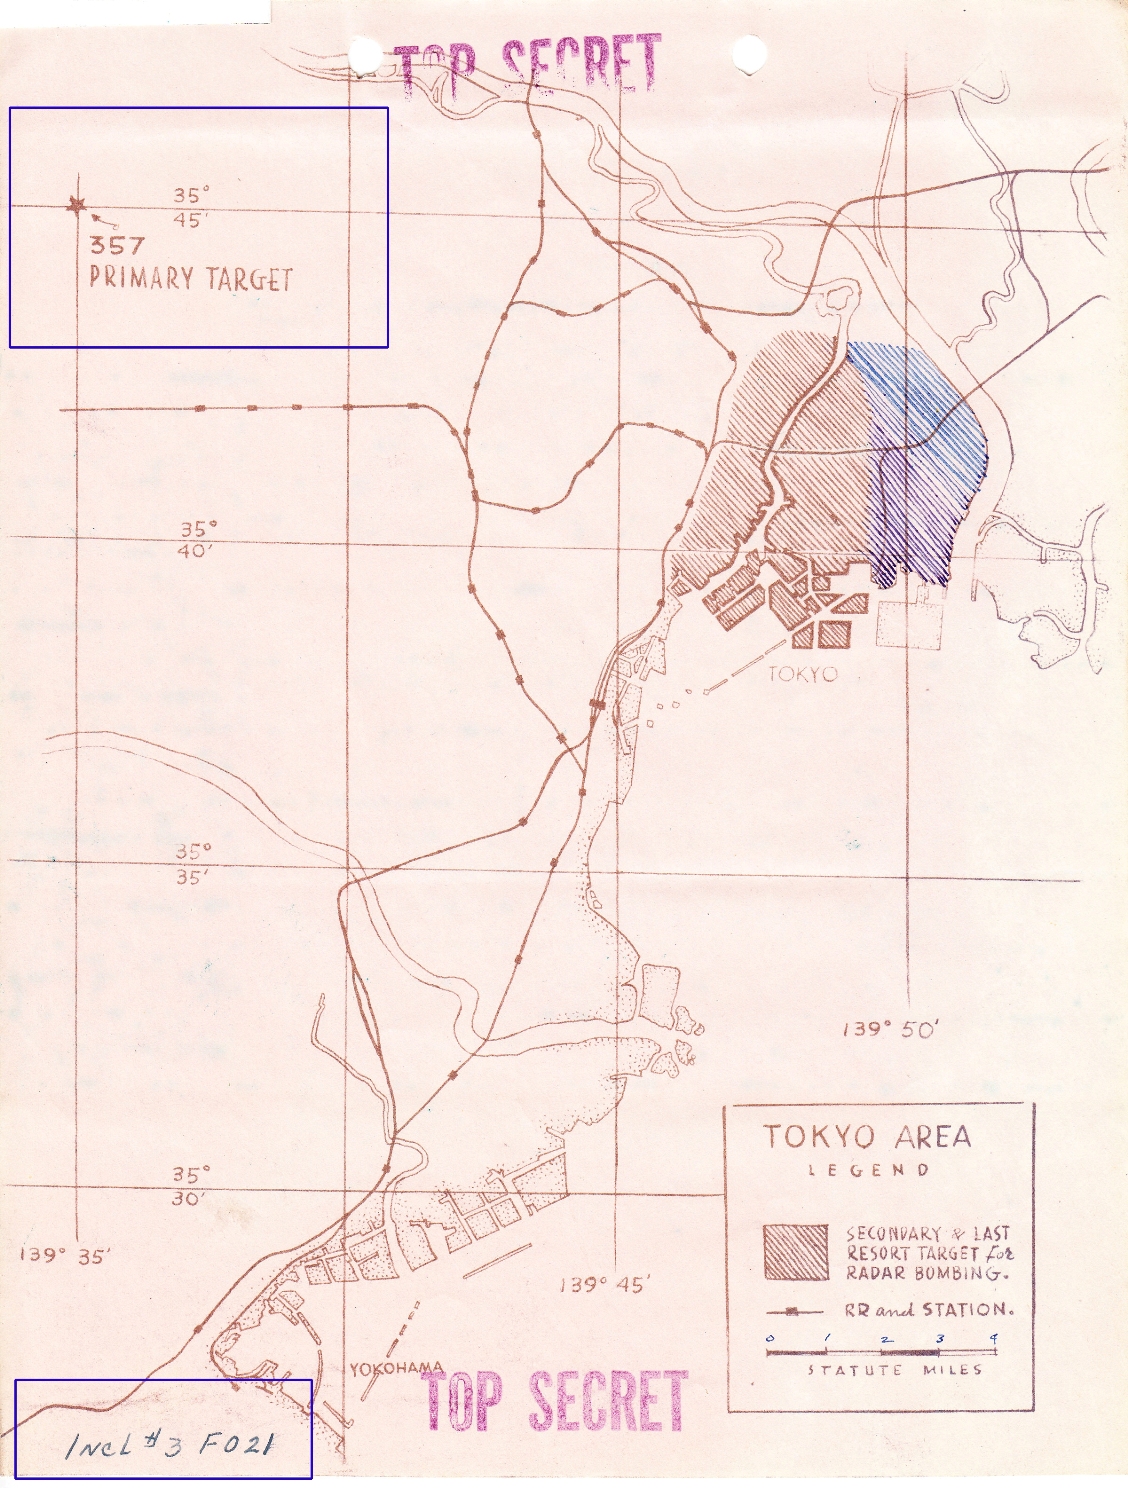
SKETCH OF PRIMARY TARGET ( NUMBER 357 ) LOCATION
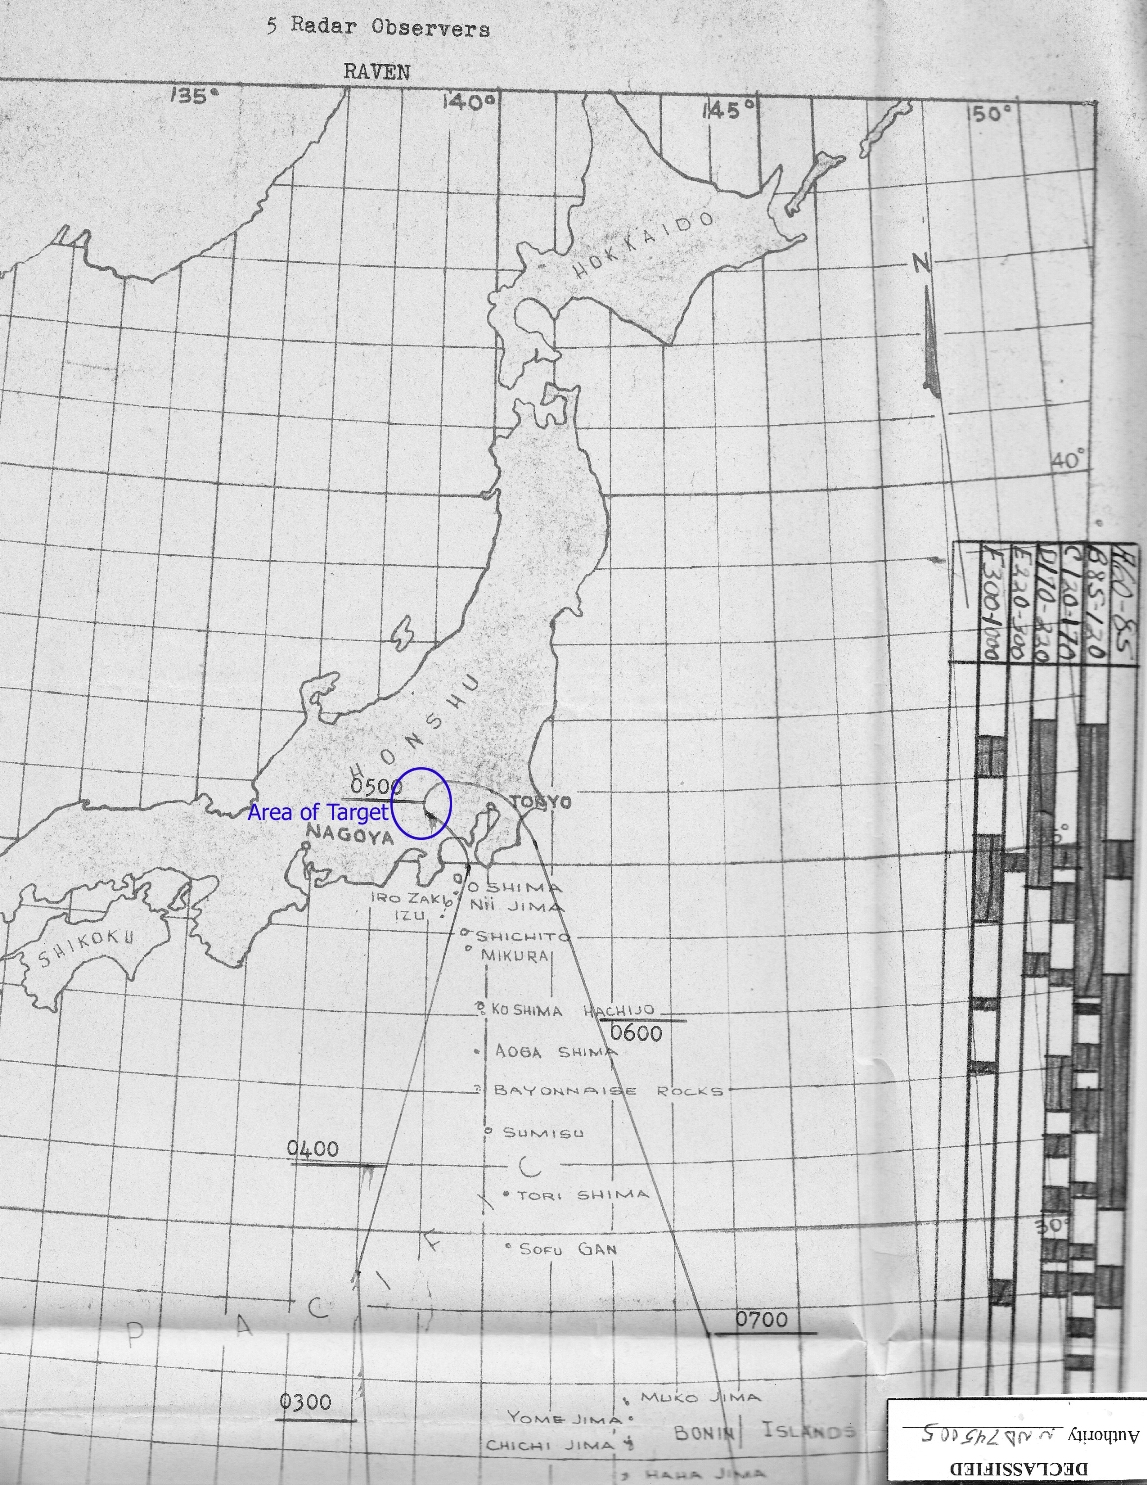
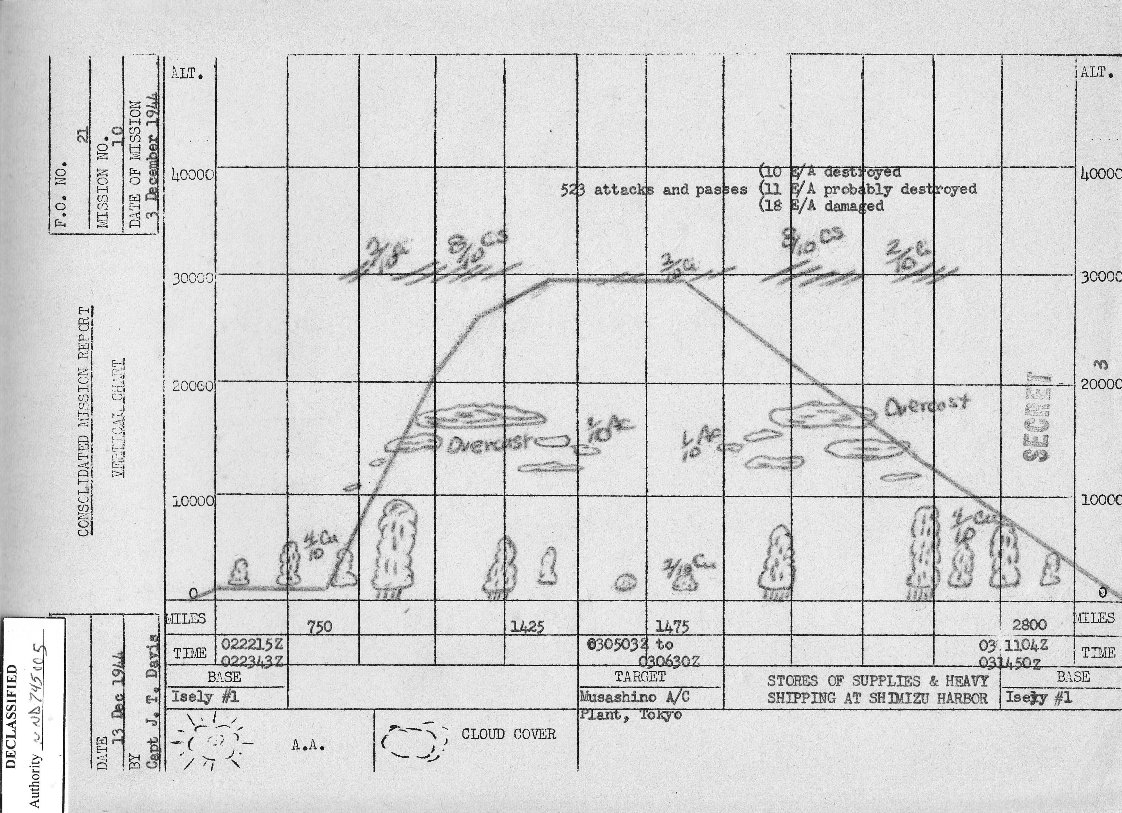
MUSASHINO


BACK TO TOP

VERTICAL CHART


BACK TO TOP

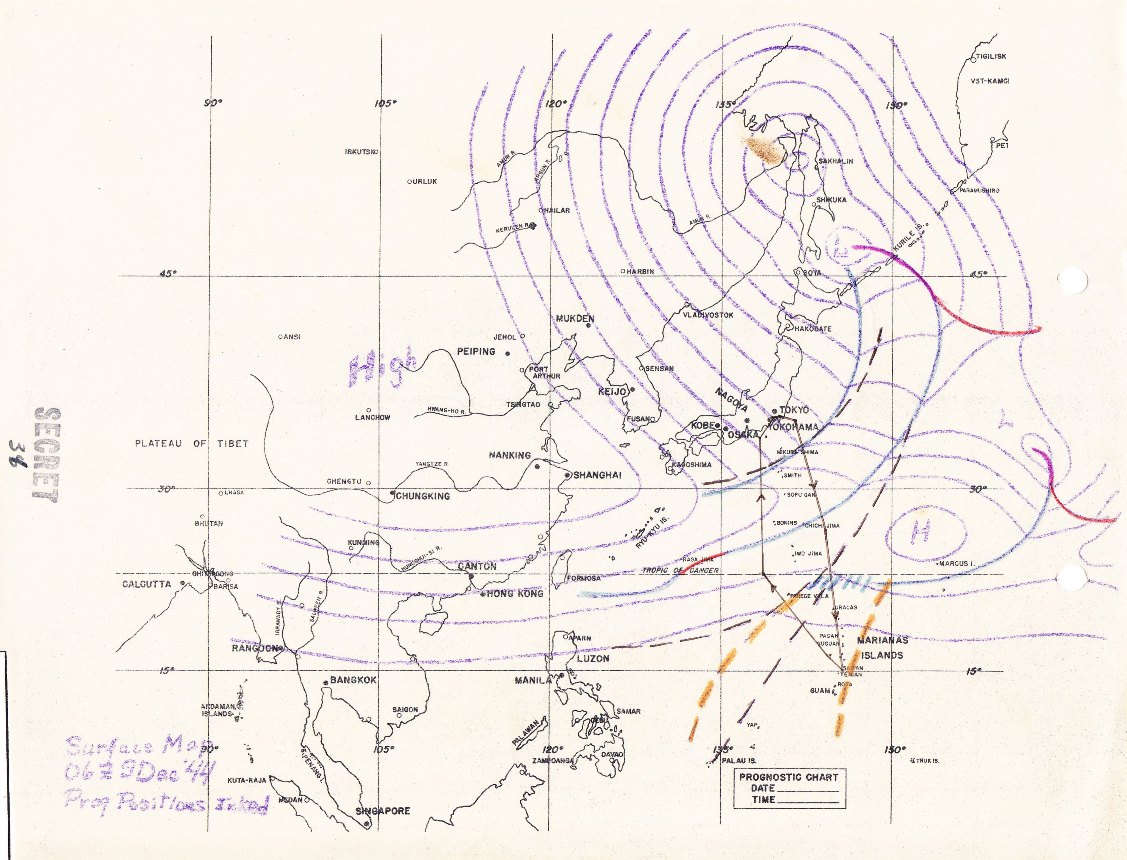
WEATHER PROGNOSTIC CHART


BACK TO TOP